The government books look far better than they did at Christmas and would still be the envy of many developed countries around the world.
Higher unemployment and higher interest rates are causes for concern in an otherwise stable economic picture.
Introduction
This is Grant Robertsons sixth Budget, and his fifth Wellbeing Budget. The government subtitled this Budget as “Support for Today, Building for Tomorrow” – setting out that investment in the economy and society was not just a short-term issue. The Minister of Finance also stated that his key aim was to help address the current cost of living issues that many are facing. The Opposition wanted to paint this Budget as simply another in a long list of high spending Budgets.
All Budgets are difficult, and they involve huge trade-offs. This Budget is no different. $4 billionn of savings were found before the Budget to help manage cost pressures. The difficulty in delivering on this Budget comes from the highly unstable background in which the Government finds itself. From natural disasters to geopolitical challenges, this Government has managed its way through crisis after crisis. There is probably much that it would like to have done, only for fate to have intervened.
Before we go any further, it is important to note two things. The economic and fiscal numbers produced in the Budget aren’t created by Ministers. They are independently generated by the Treasury, which zealously (and rightly) guards their independence in producing these forecasts. They aren’t ‘political’ in that the Minister of Finance can’t choose which numbers to present to the public.
Secondly, as statistician George Box said “all models are wrong, but some are useful.”. The data presented by the Treasury won’t be exactly right in the future, and we shouldn’t expect it to be. This is especially the case when the future is so uncertain. But we can take the information provided by the Treasury as a guide to what might happen – and probably the best guide produced by anyone in New Zealand.
Fiscal Analysis
Fiscal analysis means an examination of what the Government is planning to spend, and how it generates that money. The word fiscal comes from the word fiscus, meaning basket. In ancient Rome, fiscus was the term for money controlled by the emperor, which was often stored in baskets.
Spending
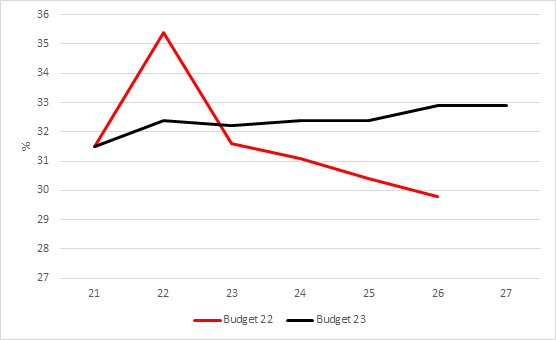
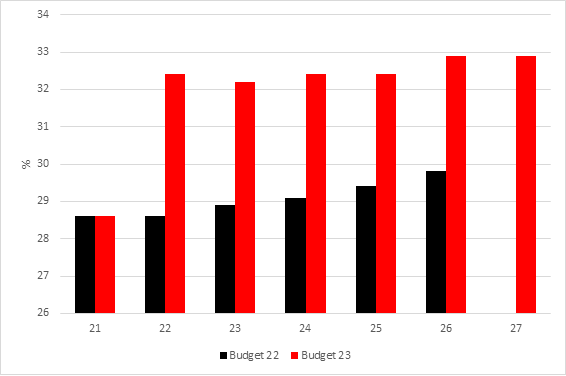
Government spending is programmed to remain much more stable than at the last Budget. Spending was expected to accelerate to 35.4% of GDP in 2022 before falling. This is now expected to come in 32.4% – and remain consistently at around the 32/33% mark. This is still much lower than our international peers, and much lower than is probably required in New Zealand.
Revenue
In order to spend money, you must first collect it. Government revenue has been the subject of much debate recently, with suggestions that the Government is collecting too much. The chart below shows that the Government is collecting more income, as the economy is running better than anticipated, and higher wage and profit growth are translating into higher taxation revenue.
OBEGAL
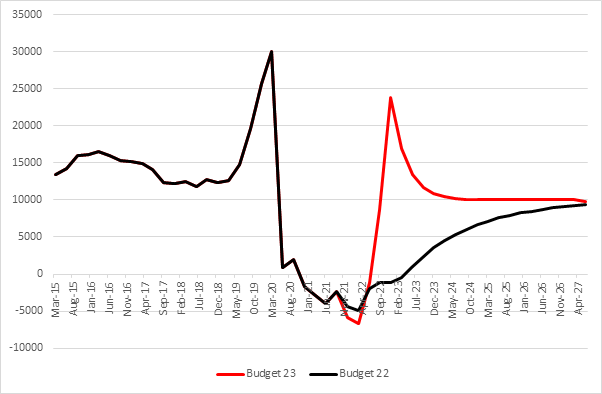
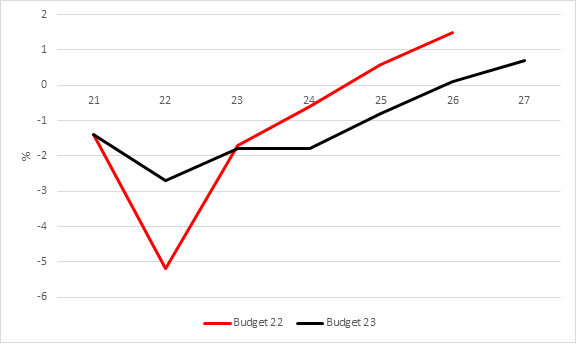
One of the indicators that many commentators look at is OBEGAL (operating balance except exceptional gains and losses). Simply put, this is the difference between the amount of money collected by government, and the amount of money spent (after you take away big one-off items). It’s supposed to show if a government is paying its own way or if it’s borrowing too much. In reality, it’s not that useful an indicator – it’s possible to have a small OBEGAL deficit and debt will continue to fall. OBEGAL is expected to now be in surplus in 2026 instead of 2024. But it is also better placed in the short run, with the deficit halved for 2022.
Net Debt
One of the most misunderstood elements of government spending is government debt. Very high government debt is dangerous and should be avoided. But very low levels of debt should also be challenged – especially if they are built from not making necessary investments. New Zealand is lucky in having low levels of public debt, arguably too low. The Government has a ‘debt ceiling’ of 30% of GDP – and at no point in time are we anywhere near this level.
Economic Analysis
GDP
In December this year, Treasury was forecasting that GDP would turn negative in 2023, and we would face a short recession. This is no longer the case, with growth now being found in all years of the forecast period. Growth this year is expected to be lower than at Budget 22, but then is expected to be higher in each of the forecast years. This is undoubtedly good news.
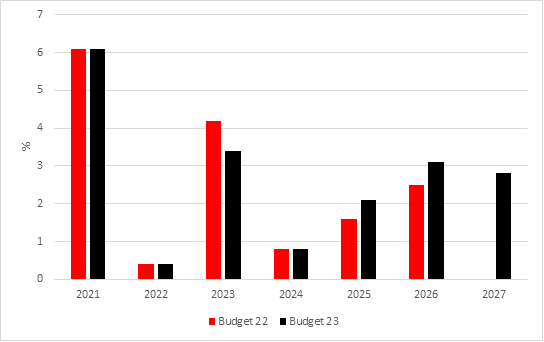
However, it will be important to see how that growth is distributed when it arrives. We have seen widening inequality in New Zealand, and we should be using the opportunity provided by these better than expected forecasts to make sure that we help to reduce that problem.
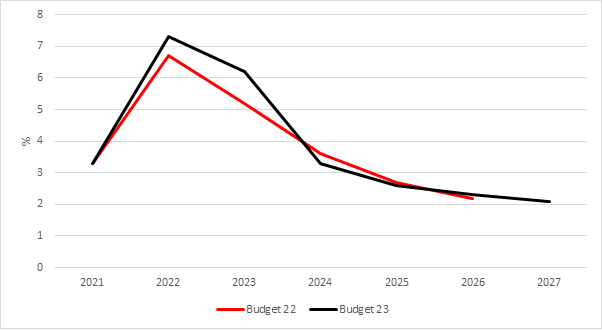
Inflation
One of the central themes of this Budget was in helping to manage inflation. Treasury is forecasting that Inflation will trend downwards across the forecast period, falling back the Government’s target rate of 1-3% by September 2024. The scale of the fall in inflation is very steep, so those struggling with the cost of living should expect some relief soon. However, it is not clear what is driving this fall. Government spending is expected to remain stable, and demand is expected to return in the private sector.
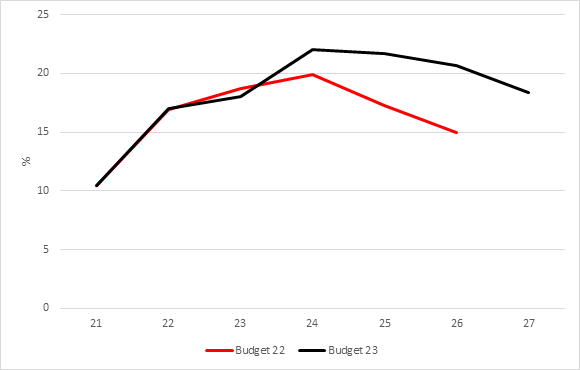
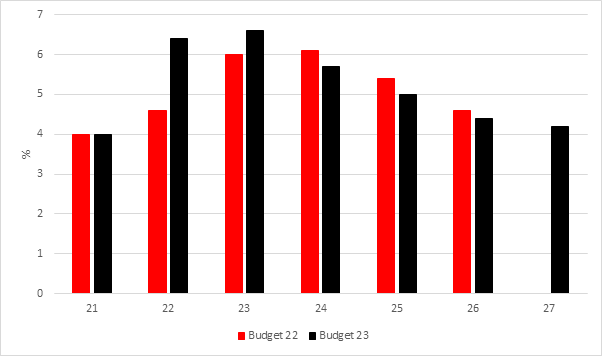
Unemployment
One of the ways in which inflation has been managed is through the Reserve Bank continuing to increase the Official Cash Rate – or the cost of borrowing. This unfortunately tends to increase unemployment as economic activity slows. The data for unemployment shows the impact of this – with unemployment rising to 5.3% in 2024 before starting to fall again.
This is a higher rate of unemployment than expected a year ago – by around consistently half a percentage point. That equates to around 15,000 more people being unemployed. While that’s not great, it is again a much better forecast than we were anticipating.
Wages
There is good news if you are in work across the forecast period – wages will rise faster than inflation each year. That means real terms wage growth every year. The not so-great news is that wage growth is expected to be lower in each year than previously forecast. That’s in part because of higher unemployment, which in turn is partly because of higher interest rates.
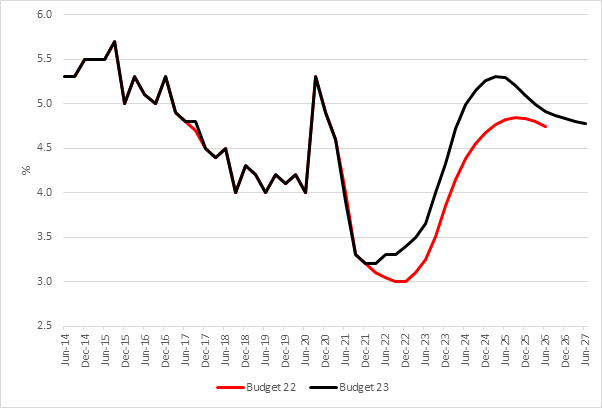
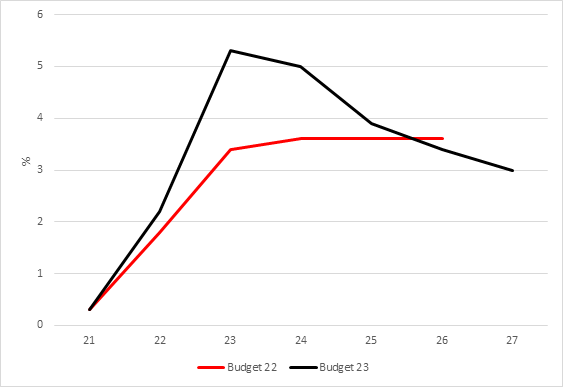
Interest Rates
Speaking of interest rates, the Treasury is forecasting that they stick around for a little longer and peak higher than expected a year ago. They return roughly back to where we expected them to be in 2025. But they don’t return to the historic lows that we saw in 2021 at all. It looks like the era of ultra-cheap mortgages is probably behind us.
House Prices
Normally, when interest rates are higher, house prices fall. New Zealand is experiencing this right now with some rapid house price falls, albeit on the back of some significant increases over the past few years. Last year the Treasury was anticipating a fall of 2.5% in house prices this year. It’s now pencilled in a fall of 13.4%. A further fall is expected in 2024.

Immigration
One of the reasons we should be very cautious about the house price chart is that immigration has returned very quickly. So quickly, we are currently breaking records for the numbers of people entering New Zealand. This is a welcome sign that New Zealand is a destination that people want to live in, but it also places increased demands on our sometimes-stretched public services.